If a man runs a temperature they get a
temperature higher than their normal temperature. It is a condition that knocks
them off balance. They fail to function properly. They don’t feel like eating. They
fail to go to work. If they go to work in spite of themselves, they
underperform. Planet Earth too does run temperature, and it is running one now,
and it is off balance as one running a temperature!
The title of this post as composed
above is a constitution of targets and timelines. If climate science is your
space you should be conversant with these targets and timelines. Those who are
concerned about the state of the natural environment should have a measure of
understanding of these targets and timelines. Those who are ignorant of these
targets and timelines should and ought to be concerned. Those who know about
these targets and timelines, and downplay them should be bothered too. Indeed,
each and every earthling should be seeing these targets and timelines as promptings
to sit up and relook at their activities on planet Earth.
Whether you live in New York City or a
far flung habitation in the Pacific Ocean, these targets and timelines have
bearing on your lifestyle, indeed your very life. A rise in the level of the
Pacific Ocean and the Atlantic Ocean will affect inhabitation of New York City
and the far flung habitation in the Pacific Ocean. Carbon dioxide released into
the atmosphere from an industrial area will cause a rise in the mean surface
temperature of planet Earth. The carbon footprint caused in the industrial area
resulting in a rise in the mean surface temperature of planet Earth affects the
habitation in the far flung habitation in the Pacific Ocean! A rise in sea
level may wipe out an island in the Pacific Ocean. A rise in sea level in New
York City may put paid to sailing in yachts. The rise in sea level may be due to
ice melting in the Artic or Antarctica. Both the Artic and Antarctica are far
from New York and a far-flung place like Hawaii in the Pacific Ocean though.
I have sounded that all earthlings
should, and ought to be concerned about the targets and timelines under
discussion. I have also indicated in paragraph two physical changes being
wrought to the surface of planet Earth, habitation for humans and other
constituents of planet Earth. The critical gap between the warnings in
paragraph one and catastrophic consequences in paragraph two are the undercurrents
of the constituents of the title! The catastrophic consequences is called
climate change. A change in the surface mean temperature resulting in the overheating
of the surface of planet Earth is called global warming. However, climate
change in some contexts encompass global warming.
In paragraph two reference has been
made to carbon dioxide as carbon footprint. Carbon footprint is the amount of greenhouse
gas released into the atmosphere. Greenhouse
gas is a constitution of many gases, not carbon dioxide only. If I have to take
them in their plurality, as greenhouse gases, they in themselves as natural
gases of the atmosphere have a critical role to play in the survival of the
inhabitants and constituents of planet Earth. They, the greenhouse gases, in
their natural functions give inhabitants of the natural environment, the right
temperature of sustenance on planet Earth. However, through the activities of
man too much greenhouse gases have been released into the atmosphere. That is
what is causing the atmosphere of planet Earth to be overheated! The
overheating of planet Earth is what is throwing the surface of planet Earth
into the turmoil described in paragraph two.
To right the turmoil ongoing on the
surface of planet Earth the targets and datelines already referenced were conceived
and harnessed. The targets and datelines and how they are being complied with are
going to be delved into in the sections that follow in perspectives that highlight
their significance and urgency under the aegis of the United Nations
Organization, for man.
The sections have been sequenced as
follows:
PARIS AGREEMENT
1.5°C
2.0°C
COMPARISON
BASELINE
2030
2050
NATIONALLY DETERMINED CONTRIBUTIONS
ARE WE ON COURSE?
CONCLUSION
PARIS AGREEMENT
The Paris Agreement serves as man’s
framework to generate the targets and timelines to contain and deal with
climate change. Man, coming in the form of United Nations Framework Convention
on Climate Change (UNFCCC). The UNFCCC is an organ of the United Nations
Organization.
The link https://unfccc.int/about-us/about-the-secretariat
informs us on the purpose of the UNFCCC as follows- The UNFCCC secretariat (UN
Climate Change) is the United Nations entity tasked with supporting the global
response to the threat of climate change. UNFCCC stands for United Nations Framework
Convention on Climate Change. The Convention has near universal membership (197
Parties) and is the parent treaty of the 2015 Paris Agreement. The main aim of the Paris Agreement
is to keep the global average temperature rise this century as close as
possible to 1.5 degrees Celsius above pre-industrial levels. The UNFCCC is also
the parent treaty of the 1997 Kyoto Protocol.
The ultimate objective of all three agreements under the UNFCCC is to stabilize
greenhouse gas concentrations in the atmosphere at a level that will prevent
dangerous human interference with the climate system, in a time frame which
allows ecosystems to adapt naturally and enables sustainable development.
Through the link https://unfccc.int/process-and-meetings/the-paris-agreement/the-paris-agreement
we are given a hint of what the Paris Agreement entails as follows:
The Paris Agreement is a legally
binding international treaty on climate change. It was adopted by 196
Parties at COP 21 in Paris, on 12 December 2015 and entered into force on 4
November 2016.
Its goal is to limit
global warming to well below 2, preferably to 1.5 degrees
Celsius, compared to pre-industrial levels.
To achieve this long-term temperature
goal, countries aim to reach
global peaking of greenhouse gas emissions as soon as possible to
achieve a climate neutral world by mid-century.
The Paris Agreement is a
landmark in the multilateral climate change process because, for the
first time, a binding agreement brings all nations into a common cause to
undertake ambitious efforts to combat climate change and adapt to its
effects.
1.5°C
This section is going to deal with the
global mean atmospheric temperature one point five degrees Celsius as a target,
and its critical and strategic role in the climate change issue. In the
preceding section it has been indicated that limiting global warming to 1.5°C was
to “reach global peaking of
greenhouse gas emissions as soon as possible to achieve a climate
neutral world by mid-century.”
Midcentury is 2050.
Through the link https://www.ipcc.ch/sr15/resources/headline-statements/
the International Panel on Climate Change (IPCC) explains the criticality of
1.5°C in the climate change issue in that which follows:
Human activities are estimated to have
caused approximately 1.0°C of global warming above pre-industrial levels, with
a likely range of 0.8°C to 1.2°C. Global warming is likely to reach 1.5°C
between 2030 and 2052 if it continues to increase at the current rate. (high
confidence)
Warming from anthropogenic emissions
from the pre-industrial period to the present will persist for centuries to
millennia and will continue to cause further long-term changes in the climate
system, such as sea level rise, with associated impacts (high confidence),
but these emissions alone are unlikely to cause global warming of 1.5°C (medium
confidence).
Climate-related risks for natural and
human systems are higher for global warming of 1.5°C than at present, but lower
than at 2°C (high confidence). These risks depend on the magnitude and
rate of warming, geographic location, levels of development and vulnerability,
and on the choices and implementation of adaptation and mitigation options (high
confidence).
Regarding emission pathways and
systems transitions IPCC says thus:
In model pathways with no or limited
overshoot of 1.5°C, global net anthropogenic CO2 emissions
decline by about 45% from 2010 levels by 2030 (40–60% interquartile range),
reaching net zero around 2050 (2045–2055 interquartile range). For limiting
global warming to below 2°C CO2 emissions are projected to
decline by about 25% by 2030 in most pathways (10–30% interquartile range) and
reach net zero around 2070 (2065–2080 interquartile range). Non-CO2 emissions
in pathways that limit global warming to 1.5°C show deep reductions that are
similar to those in pathways limiting warming to 2°C. (high confidence)
Pathways limiting global warming to
1.5°C with no or limited overshoot would require rapid and far-reaching
transitions in energy, land, urban and infrastructure (including transport and
buildings), and industrial systems (high confidence). These systems
transitions are unprecedented in terms of scale, but not necessarily in terms
of speed, and imply deep emissions reductions in all sectors, a wide portfolio
of mitigation options and a significant upscaling of investments in those
options (medium confidence).
The Intergovernmental Panel on Climate
Change (IPCC) is the United Nations Organization’s body for assessing the
science connected to climate change. The
IPCC was created to provide policymakers with regular scientific
assessments on climate change, its implications and potential future risks, as
well as to put forward adaptation and mitigation options. (https://www.ipcc.ch/)
2.0°C
What about
two degrees Celsius in the equation? In the preceding section I have touched on
the temperature two degrees Celsius in passing. In this section I am going to
take a deeper look at it. To do that I should resort to a portion of an article
by a Brad Plumer dated April 22, 2014. That portion is sourced through the link
https://www.vox.com/2014/4/22/5551004/two-degrees
as follows:
Back in the
1970s, climate scientists understood that the carbon dioxide that humans had
been emitting since the Industrial Revolution — from cars, power plants,
factories — was intensifying the
greenhouse effect that warms the planet. They also knew that
man-made emissions were increasing each year as the global economy grew.
So how hot
would it get? Early calculations suggested that if we doubled the amount of
carbon dioxide in the atmosphere over pre-industrial levels, the Earth would
warm somewhere between 1.5°C and 4.5°C. In the decades since, scientists have
amassed more evidence for this estimate of "climate
sensitivity," but they haven't really narrowed the range.
The next
step was to figure out how much warming humans could safely tolerate. There
were a variety of ideas for defining "dangerous"
interference with the Earth’s climate in the early 1990s.
Maybe we should try to limit the rate of warming per decade, for instance.
Eventually,
the 2°C limit won out — endorsed by, among others, a council of German
scientists advising Angela Merkel, the nation’s environment minister at the
time. Their thinking: human civilization had developed in a period when sea
levels remained stable and agriculture could flourish. Staying within that
bound — and preventing global average temperatures from rising more than 2°C —
seemed like a reasonable rule of thumb.
"We
said that, at the very least, it would be better not to depart from the
conditions under which our species developed," recalls Hans Joachim
Schellnhuber, one of the scientists on that German advisory panel who helped
devise the 2°C limit. "Otherwise we’d be pushing the whole climate system
outside the range we’ve adapted to."
Over time,
researchers gravitated toward this limit. An influential 2001 report from
the UN’s Intergovernmental Panel on Climate Change detailed a number of reasons
to worry about climate change: increased heat waves and storms, the threat of
mass extinctions, severe economic losses. Many of these so-called "reasons
of concern" were projected to get much worse as global
warming climbed past 2°C.
Now, the 2°C
limit is ultimately arbitrary. Any limit would be. Subsequent
research has
found, for instance, that plenty of worrisome impacts
actually happen well before we hit 2°C: Arctic summer sea ice
could collapse, coral reefs could die off, tiny island nations like Tuvalu
could get swallowed by the rising seas. Conversely, other worrisome changes,
such as crop damage in the United States, might not happen until we go above
the 2°C threshold.
Deciding where
to draw this line involves political judgments as much as a scientific ones.
Or, to put it another way, no climate scientist thinks we'll be totally fine if
we hit 1.9°C of warming but totally doomed if we hit 2.1°C.
Economists,
meanwhile, have often criticized the 2°C limit for not taking costs into
account. After all, we don’t just burn oil, gas, and coal for fun. We use them
to power our cars and homes and factories. And cutting back won't be painless.
William Nordhaus, an economist at Yale, has argued that we should aim for a
temperature limit where the costs of reducing fossil fuels matches the climate
benefits. In his book The
Climate Casino, he pegs this limit at 2.5°C or possibly
higher, depending on how easily we can switch to clean energy sources.
Yet despite
the all the kvetching, the 2°C limit has maintained its dominant position for
more than a decade — in part because it created an easy focal point for
international negotiations. Many policy proposals start by assuming the need to
stay below 2°C and then work backward to hash out how each country should cut
emissions. The European Union’s energy policies consistently
reference the 2°C limit. The Obama administration’s
upcoming rules to restrict carbon-dioxide emissions from US coal plants can
be traced back to a pledge President Obama made in 2009 to
help stay below 2°C.
So that
raises a troubling question: what will happen if it becomes apparent that the 2°C
limit is out of reach? Will we settle on a new limit? Or just give up
altogether?
So we can
infer from the foregoing that man somewhat adopted the 2.0°C as atmospheric
mean temperature ceiling beyond which they should not go, by their activities
which result in the release of greenhouse gases into the atmosphere if the
climatic conditions of planet Earth are not to become more catastrophic.
COMPARISON
The IPCC has
released a special report on global warming of 1.5°C. In the report there is a
comparison between the mean temperatures of 1.5°C and 2.0°C. This section looks
at that comparison.
The
introduction to the report called Special Report for Policy Makers (a summary
of the main report) reveals the reasons for the special report (https://www.ipcc.ch/sr15/chapter/spm/):
This Report
responds to the invitation for IPCC ‘… to provide a Special Report in 2018 on
the impacts of global warming of 1.5°C above pre-industrial levels and related
global greenhouse gas emission pathways’ contained in the Decision of the 21st
Conference of Parties of the United Nations Framework Convention on Climate
Change to adopt the Paris Agreement.
This Summary
for Policymakers (SPM) presents the key findings of the Special Report, based
on the assessment of the available scientific, technical and socio-economic
literature relevant to global warming of 1.5°C and for the comparison
between global warming of 1.5°C and 2°C above pre-industrial levels.
In chapter 5
of the SPM under the heading “Sustainable Development, Poverty and Inequality
in a 1.5°C Warmer World” (https://www.ipcc.ch/sr15/), the comparison is made
between global mean temperatures of 1.5°C and 2.0°C as follows:
Limiting global warming to 1.5°C
rather than 2°C above pre- industrial levels would make it markedly easier to
achieve many aspects of sustainable development, with greater potential to
eradicate poverty and reduce inequalities (medium evidence, high agreement). Impacts avoided with the lower temperature limit could reduce the
number of people exposed to climate risks and vulnerable to poverty by 62 to
457 million, and lessen the risks of poor people to experience food and water
insecurity, adverse health impacts, and economic losses, particularly in
regions that already face development challenges (medium evidence, medium
agreement).
Compared to current conditions, 1.5°C
of global warming would nonetheless pose heightened risks to eradicating
poverty, reducing inequalities and ensuring human and ecosystem well- being (medium
evidence, high agreement). Warming
of 1.5°C is not considered ‘safe’ for most nations, communities, ecosystems and
sectors and poses significant risks to natural and human systems as compared to
the current warming of 1°C.
The
comparison simply tells earthlings that dealing with the mean temperature of
1.5°C will cause lesser side effects than dealing with the mean temperature
2.0°C. The report says further that compared to the current mean temperature of
1.0°C, the mean temperature of 1.5°C would nonetheless aggravate world
conditions! With the current mean temperature of 1.0°C or so, the deteriorating
state of the world is obvious to those who care to know, let alone the mean
temperature of 1.5°C, worse still 2.0°C.
BASELINE
From what baseline
was the atmospheric mean temperatures of one point five degrees and two degrees
projected? What is the basis of atmospheric temperatures of 1.5°C and 2.0°C as
targets under discussion in the three preceding sections? Based on these
questions this section will deal with the background and build up to the
determination of the two targets to make a more informed reading and knowledge.
The previous
sections have made reference to the key term pre-industrial level in terms of
the temperature targets. The atmospheric mean temperatures of 1.5°C and 2.0°C
are related to the term pre-industrial level as a basis of measuring, directing
and controlling global warming today. That basis is the baseline for projecting
the targets of 1.5°C and 2.0°C.
But what
does that baseline entail?
That
question is answered from the glossary of the Intergovernmental Panel on
Climate Change. That glossary defines pre-industrial as: The multi-century
period prior to the onset of large-scale industrial activity around 1750.
The reference period 1850–1900 is used to approximate
pre-industrial global mean surface temperature (GMST).
Got that? The
period between 1850 and 1900 is the period used to approximate pre-industrial
GMST. This is the standard accepted and used by the United Nations Organization
as the global baseline for measuring and tracking today’s global mean surface
temperature.
But then
what was that approximated global mean surface temperature then? Between 1850
and 1900. For it is the specific mean global surface temperature then that give
us a clear baseline with which man can measure the current direction of GMST.
And for that matter whether we are reigning in the rise in the GMST or not.
Comparing
current (November, 2015) temperatures with the preindustrial global mean
temperatures, the link https://en.mercopress.com/2015/11/10/global-temperatures-are-1.02c-above-1850-1900-average-and-climbing-warns-uk-met-office
says:
Global
temperatures are set to rise more than one degree above pre-industrial levels
according to the UK's Met Office. Figures from January to September this year
are already 1.02C above the average between 1850 and 1900.
If
temperatures remain as predicted, 2015 will be the first year to breach this
key threshold. The world would then be half way towards 2C, the gateway to
dangerous warming.
The new data
is certain to add urgency to political negotiations in Paris later this month
aimed at securing a new global climate treaty.
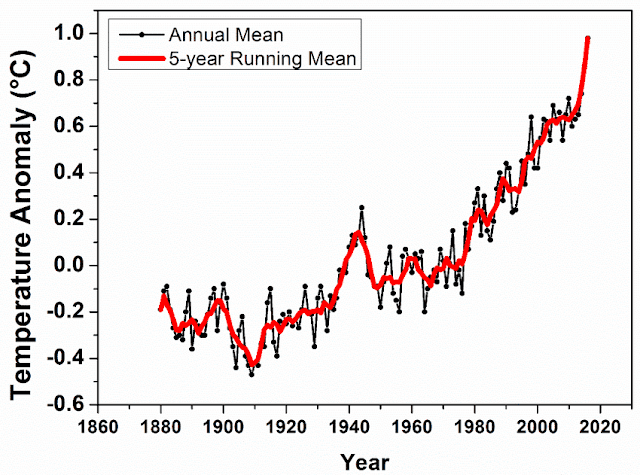
2013, the
Intergovernmental Panel on Climate Change reported that the combined land and
ocean temperature showed warming of 0.85C between 1880 and 2012.
They also
noted that the difference in the average temperatures from the 1850 to 1900
period was 0.78C when compared to the average between 2003 and 2012.
2030
The year
2030 is a critical timeline in the climate change equation. Paragraph 3 of the section
of this post titled 1.5°C says “Human activities are estimated to have caused
approximately 1.0°C of global warming above pre-industrial levels, with a
likely range of 0.8°C to 1.2°C. Global warming is likely to reach 1.5°C between
2030 and 2052 if it continues to increase at the current rate. (high
confidence)”.
Reference https://www.iea.org/reports/net-zero-by-2050
(Executive Summary of IEA’s report titled Roadmap to Net Zero by 2050). In the
executive summary, the section titled “Net zero by 2050 hinges on an
unprecedented clean technology push to 2030” says in paragraph 1:
The path to
net-zero emissions is narrow: staying on it requires immediate and massive
deployment of all available clean and efficient energy technologies. In
the net-zero emissions pathway presented in this report, the world economy in
2030 is some 40% larger than today but uses 7% less energy. A major worldwide
push to increase energy efficiency is an essential part of these efforts,
resulting in the annual rate of energy intensity improvements averaging 4% to
2030 – about three-times the average rate achieved over the last two decades.
Emissions reductions from the energy sector are not limited to CO2:
in our pathway, methane emissions from fossil fuel supply fall by 75% over the
next ten years as a result of a global, concerted effort to deploy all
available abatement measures and technologies.
While
paragraph 1 stresses the need for massive deployment of clean energy
technologies, paragraph 2 which follows emphasizes the need for cheaper
renewable energy technologies, if massive deployment is to be realized, as it
were.
Ever-cheaper
renewable energy technologies give electricity the edge in the race to zero. Our
pathway calls for scaling up solar and wind rapidly this decade, reaching
annual additions of 630 gigawatts (GW) of solar photovoltaics (PV) and 390 GW
of wind by 2030, four-times the record levels set in 2020. For solar PV, this
is equivalent to installing the world’s current largest solar park roughly
every day. Hydropower and nuclear, the two largest sources of low-carbon
electricity today, provide an essential foundation for transitions. As the
electricity sector becomes cleaner, electrification emerges as a crucial
economy-wide tool for reducing emissions. Electric vehicles (EVs) go from
around 5% of global car sales to more than 60% by 2030.
2030 is the
critical year to attain a mean temperature of 1.5°C if man is to hit the target
of net zero emissions in the year 2050. 2030 is also yet another projected milestone
for the attainment of United Nations’ SDGs (Sustainable Development Goals)!
The
interconnectivity between attainment of a mean temperature of 1.5°C by 2030 and
the sustainable development goals in 2030 integratively is coherently expressed
thus:
Collectively,
the three post-2015 agendas for action – the Paris Agreement, the 2030 Agenda
for Sustainable Development and the Sendai Framework for Disaster Risk
Reduction - provide the foundation for sustainable, low-carbon and resilient
development under a changing climate.
Achieving
the primary goal of the Paris Agreement - to keep the average
global temperature rise well below 2C degrees and as close as possible to 1.5C
above pre-industrial levels - is vital to the achievement of all three Agendas.
The global average temperature has already increased by around one degree,
since then underlining the urgency of action if we are to stay as close as
possible to 1.5C degrees. (https://unfccc.int/topics/action-on-climate-and-sdgs/action-on-climate-and-sdgs)
2050
The year
2050 is an important projection in the Paris Agreement. A requote from the
section of this post titled Paris Agreement says:
“The Paris
Agreement is a legally binding international treaty on climate change. It
was adopted by 196 Parties at COP 21 in Paris, on 12 December 2015 and entered
into force on 4 November 2016.
Its goal
is to limit global warming to well below 2, preferably to 1.5
degrees Celsius, compared to pre-industrial levels.
To achieve
this long-term temperature goal, countries aim to reach global peaking of
greenhouse gas emissions as soon as possible to achieve a climate neutral
world by mid-century.”
Note the
phrase mid-century! It is the middle of this century- 2050! By that projection
man is expected to reach “a climate neutral world by” 2050. What does the term
climate neutral mean? I am not getting the definition of “climate neutral” in
the IPCC Glossary, but I got that for climate neutrality and that term is
defined as:
Concept of a
state in which human activities result in no net effect on the climate
system. Achieving such a state would require balancing of residual
emissions with emission (carbon dioxide) removal as well as
accounting for regional or local biogeophysical effects of human activities
that, for example, affect surface albedo or local climate.
A related
term for climate neutrality is Net Zero CO₂ emissions. From the IPCC Glossary
the term is defined thus:
Net
zero carbon dioxide (CO2) emissions are achieved
when anthropogenic CO2 emissions are balanced
globally by anthropogenic CO2 removals over a specified period.
Net zero CO2 emissions are also referred to as carbon
neutrality.
The year
2050, by the Paris Agreement, is therefore projected to bring about an era of
balance in global anthropogenic CO₂ emissions and removals. For example, if 20 tons of carbon dioxide is
released into the atmosphere, the carbon dioxide so released must not linger in
the atmosphere in whole or in part. The entire carbon dioxide must be removed
from the atmosphere by trees which serve as sink, or by carbon capture and
storage (CCS).
So by the Paris Agreement projection of 2050, we are expected to be ushered into a whole new world! Its feasibility is another matter though.
NATIONALLY
DETERMINED CONTRIBUTIONS
How is man
meeting the temperature targets they have set themselves, and by the set
datelines? How do earthlings attain a net zero carbon dioxide emissions world
by 2050? How do earthlings keep global mean temperature to 1.5C by 2030 towards
a climate neutrality in 2050?
The United
Nations Framework Convention on Climate Change in casting the Paris Agreement
made provision for how targets set are to be met. The targets are to be met by
an international program called Nationally Determined Contributions (NDCs).
Through the
link https://unfccc.int/process-and-meetings/the-paris-agreement/nationally-determined-contributions-ndcs/nationally-determined-contributions-ndcs
the Paris Agreement tells us how the temperature targets and datelines are
intended to be met:
Nationally
determined contributions (NDCs) are at the heart of the Paris Agreement and the
achievement of these long-term goals. NDCs embody efforts by each country to
reduce national emissions and adapt to the impacts of climate change. The Paris
Agreement (Article 4, paragraph 2) requires each Party to prepare,
communicate and maintain successive nationally determined contributions (NDCs)
that it intends to achieve. Parties shall pursue domestic mitigation measures,
with the aim of achieving the objectives of such contributions.
The Paris
Agreement requests each country to outline and communicate their post-2020
climate actions, known as their NDCs.
Together,
these climate actions determine whether the world achieves the long-term goals
of the Paris Agreement and to reach global peaking of greenhouse gas (GHG)
emissions as soon as possible and to undertake rapid reductions thereafter in
accordance with best available science, so as to achieve a balance between
anthropogenic emissions by sources and removals by sinks of GHGs in the second
half of this century. It is understood that the peaking of emissions will take
longer for developing country Parties, and that emission reductions are
undertaken on the basis of equity, and in the context of sustainable
development and efforts to eradicate poverty, which are critical development
priorities for many developing countries.
NDCs are
submitted every five years to the UNFCCC secretariat. In order to enhance the
ambition over time the Paris Agreement provide that successive NDCs will
represent a progression compared to the previous NDC and reflect its highest
possible ambition.
Parties are requested to submit the next round of NDCs (new NDCs or updated NDCs) by 2020 and every five years thereafter (e.g. by 2020, 2025, 2030), regardless of their respective implementation time frames.
ARE
WE ON COURSE?
Man has
conceived a course, and structured it to meet the targets and datelines. Is man
following the course they have set for themselves? What are the prospects of
meeting the targets and datelines? Temperature targets of 1.5°C and 2.0°C and
datelines of 2030 and 2050. The thinking is that if man is able to keep mean
temperature down to 1.5°C by 2030, man could hit net zero emissions by 2050.
Man is in the
year 2021 now, 9 years from 2030, and 29 years from 2050. Where have we reached
in the net zero emissions journey?
An IEA
(International Energy Agency) flagship report titled “Net Zero by 2050, Roadmap
for the Global Energy Sector” and dated May 2021 should provide answers to
questions asked hitherto. In the foreword to the report, Dr. Fatih Birol, Executive Director, International Energy Agency had
this to say in the first two paragraphs:
We are
approaching a decisive moment for international efforts to tackle the climate
crisis- a great challenge of our times. The number of countries that have
pledged to reach net- zero emissions by mid- century or soon after continues to
grow, but so do global greenhouse gas emissions. This gap between rhetoric and
action needs to close if we are to have a fighting chance of reaching net zero
by 2050 and limiting the rise in global temperatures to 1.5°C.
Doing so
requires nothing short of a total transformation of the energy systems that
underpin our economies. We are in a critical year at the start of a critical
decade for these efforts. The 26th Conference of the Parties (COP26)
of the United Nations Framework Convention on Climate Change in November is the
focal point for strengthening global ambitions and action on climate by
building on the foundations of the 2015 Paris Agreement.
The Executive Summary of the report
(page 13) throws light on the achievability of net zero emissions by 2050:
In this Summary for Policy Makers, we outline the essential conditions for the global energy sector to reach net- zero CO2 emissions by 2050. The pathway described in depth in this report achieves this objective with no offsets from outside the energy sector, and with low reliance on negative emissions technologies. It is designed to maximise technical feasibility, cost-effectiveness and social acceptance while ensuring continued economic growth and secure energy supplies. We highlight the priority actions that are needed today to ensure the opportunity of net zero by 2050- narrow but still achievable- is not lost. The report provides a global view, but countries do not start in the same place or finish at the same time: advance economies have to reach net zero before emerging markets and developing economies, and assist others in getting there. We also recognize that the route mapped out here is a path, not necessarily the path, and so we examine some key uncertainties, notably concerning the roles played by bioenergy, carbon capture and behavioural changes. Getting to net zero will involve countless decisions by people across the world, but our primary aim is to inform the decisions made by policy makers, who have the greatest scope to move the world closer to its climate goals.
CONCLUSION
1.5°C,
2.0°C, 2030 and 2050 are crucial global mean temperature targets and datelines
set by man (United Nations Organization) to bring the global mean temperature
which has gone haywire (climate change) to normalcy- net zero. 1.5°C is 1.5°C
above pre-industrial levels. And 2.0°C is 2.0°C above pre-industrial levels. By
projection, keeping the mean temperature to 1.5°C by 2030 gives hope for net
zero emissions by 2050. The 2.0°C pathway is seen as a target that should not
lead to a net zero emission by 2050!
The United
Nations Organization spearheads the fight against climate change. Though it
spearheads the fight against climate change, it actually generates ideas and
frameworks with which nations or member countries may use to fight climate
change. Ideas and frameworks are generated through the instrumentalities of
bodies such as UNFCCC, IPCC and IEA etc. One such critical framework with which
the issues of climate change are being fought globally is the Paris Agreement!
Performance
by man, using the foregoing targets and datelines as yardstick shows that man
is lagging in keeping pace with the targets and datelines they have set
themselves to hit net-zero emissions by 2050! Currently man is generating mean
temperature of 1.0°C above pre-industrial levels, with a range of 0.8°C- 1.2°C.
This is as a result of failure of nations to fulfil commitments under the United
Nations’ Nationally Determined Contributions program. By this rate man cannot hit
I.5°C by 2030, and for that matter net-zero emissions by 2050. But, net zero
emissions by 2050 is a must-achieve target.
How then is
that done?
That could be done through a radically massive deployment of clean energy technologies in the decade 2020- 2030 as indicated by the IEA May 2021 Net Zero by 2050 report. Clean energy technologies must become cheaper still. Headways are being made in the areas of solar, wind etc. yet. There must be more of that. Achieving net zero emissions by 2050 must be, and is a globally all-encompassing concern and program for each and every earthling! This is an all- hands on deck affair. Nations must keep faith with their commitments to the Nationally Determined Contributions program of the United Nations Organization. It involves governments, policy makers, institutions, companies and individuals. It involves you and me! If the surface of the Earth becomes too overheated to sustain life- yours and mine, it should be too late for us to put in a salvation salvo.
Ref.:
https://www.bing.com/images/search?view=detailV2&ccid=zOxwpEO%2f&id=7748684E510E8A3C45E166928B328699F9AA93F3&thid=OIP.zOxwpEO_dMV2nevRz3brjwHaFf&mediaurl=https%3a%2f%2fwww.researchgate.net%2fprofile%2fRaphael_Chattot%2fpublication%2f337741284%2ffigure%2ffig1%2fAS%3a832423709388804%401575476686817%2fGlobal-surface-temperature-anomalies-mean-estimates-based-on-land-and-ocean-data.ppm&cdnurl=https%3a%2f%2fth.bing.com%2fth%2fid%2fR.ccec70a443bf74c5769debd1cf76eb8f%3frik%3d85Oq%252bZmGMouSZg%26pid%3dImgRaw&exph=631&expw=850&q=images+for+surface+mean+temperature&simid=608038279698925127&FORM=IRPRST&ck=8BF9526EB7E97B1721E1FFD0D52DB0BB&selectedIndex=0&idpp=overlayview&ajaxhist=0&ajaxserp=0
Comments
Post a Comment